

Broken Broker Scorecards: Part 1
My first car was a 1976 AMC Hornet, affectionately dubbed “the Blue Hornet." My car cost $350, was notable only for having a vinyl roof that was off a few shades due to my ill-advised attempts at home repair.
Many of my friends racked up the speeding tickets while my driving record remained clean. My parents were proud of how responsibly I drove the car. However the true reason for my lack of speeding tickets wasn’t how responsible I am, but that the 11-year-old Blue Hornet couldn’t have achieved 55 miles per hour if I drove it off of the side of a cliff. I was more in danger of getting a ticket for obstructing traffic if I dared to drive in the fast lane.
The Hornet came to mind recently when I was working with a client on some broker algorithm evaluations. Our client was reviewing some performance data from their TCA system.
The client looked at a series of performance related metrics and they all showed a similar trend in algorithm rankings.
Broker 1 had:
- The lowest cost as compared to arrival price
- The lowest deviation of arrival price
- The highest participation rate
- The lowest opportunity cost (as measured from start to end of the order)
In addition, broker 1 scored highest on the TCA vendor’s “report card”
Looking at arrival price benchmarks yielded the following results:
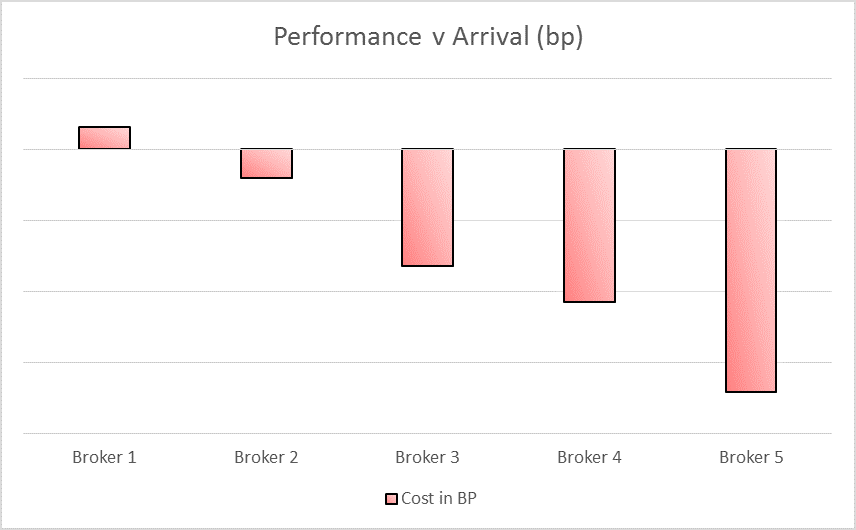
It was obvious to the TCA vendor (as well as Broker 1) that Broker 1 had the best performing algorithm. The client disagreed, stating that the algorithms were ranked in the exact opposite manner of how they would rank the same algorithms.
We took our data and ran the same numbers and came up with similar results, but we noticed something interesting in our analysis – a Blue Hornet.
While we only looked at marketable orders (as we hope the TCA vendor did), we found that marketable orders exhibited different characteristics for each of the different algorithms. Brokers that the client “trusted” were given much looser limits than brokers that the client didn’t trust.
Adding the difference between arrival prices and limit prices to the chart added detail to the picture. The yellow bars represent the worst possible outcome based on the limit price the client put on the trades.

Broker 1 had the best arrival price metrics because limit prices prevented the algorithms from straying too far from arrival price. Broker 5 had the worst performance compared to arrival price because the limits placed on the orders allowed them to do so.
Let’s look at something that the report card didn’t account for--fill rates by broker:

Because broker 1 was given the tightest limits, they had the lowest completion rate.
Look at a few sample trades:
- Broker 1 is given 100,000 shares of stock to buy. Current price is 100, limit price is 100.05
- Broker 2 is given 100,000 shares of the same stock to buy, with a limit of 101
In a worst case scenario, broker 1 can immediately sweep through the book and buy the following amounts:
- 100 @ 100
- 200 @ 100.02
- 400 @ 100.04
- 300 @ 100.05
The order would then end, due to the limit being reached, with an IS cost of 3.5 basis points
Now consider Broker 2, given the same order, works the order over the course of the day and completes the order with an average price of 100.10.
Broker 2 has approximately 3 times the cost against arrival price and a lower participation rate. That means that Broker 2 will have worse performance in the report card, in spite of doing a better job.
Broker 1’s performance was driven by the actions of the trader, not the quality of the algorithm. Broker algorithms that were given tight limits could not perform worse than those limits, so they looked better across a range of metrics. I frequently hear that traders abandon the original broker algorithm in frustration because of frustration with fill rates—and then who gets charged for the true trading cost? The broker doing clean-up duty, not broker 1!
Maybe my parents knew exactly what they were doing when they gave me that Hornet.
Next post: More on broker report cards